Thursday, December 15, 2011

LED killed the fairy light

I noticed something while visiting my local hardware store today: they had no incandescent fairy lights this year. None at all. All LED. It's sad to see such an old technology die.

The "fairy light" is 129 years old this year. Its etymology comes from the Gilbert and Sullivan operetta Iolanthe which opened on 25 November 1882. The story is about fairies and someone had the bright idea of festooning some of the principle fairies with miniature light bulbs powered by a small battery. Apparently it caused quite a sensation and the term "fairy light" came into common use ever since.

Installing Cadsoft Eagle 6 on Ubuntu 10.4

Update (19 Dec 2014): Just reviewing old blog posts. This article is now way out of date. Please ignore.

Update (5 Mar 2012): I've just been informed that libpng-1.4.8 has been replaced by libpng-1.4.9 and removed from ftp.simplesystems.org. I'll update the script in the next few days. In the mean time, please edit the script to change the version of libpng.

The recently released Eagle 6 from Cadsoft has a dependency on libpng 1.4, libjpeg 8, libcrypt 1.0, libssl 1.0. My Ubuntu 10.4 distribution has older versions of these libraries which Eagle 6 does not like.

There are a few posts on how to fix this, eg this one. However it relies on some helpful person's pre-built binaries. While I'm sure it's perfectly good, I'm just a little too paranoid to copy and execute code from an unknown source. So I set about downloading and building these libraries from source. I've written up the procedure as a bash script in case someone as paranoid as myself would like to do the same.

This script will build these libraries from source, and copy them to a directory specifically for use with Eagle.

This is the procedure:
  1. First create an empty directory. Copy this script into it. Next open the script with an editor.
  2. Set EAGLE_DEPS_DIR to a location where you want the libraries to be copied to after building (eg /home/joe/libeagle in my case)
  3. I recommend that you verify the download locations of the library sources before you run this script. This is security best practice: it's generally not a good idea to download and execute code from an untrusted source. Once you are happy with the download URLs, then set I_HAVE_VERIFIED_DOWNLOAD_LOCATIONS=true
  4. Save and run the script. If it's your first time running it, it will download the sources. Subsequent runs wont waste bandwidth if they are already there. Building the libraries will take a few minutes.
  5. Verify the contents of the directory defined in EAGLE_DEPS_DIR. It should have the following files:
    • libcrypto.so.1.0.0
    • libjpeg.so.8.3.0
    • libpng14.so.14.8.0
    • libssl.so.1.0.0
    and these symbolic links:
    • libjpeg.so.8 -> /home/joe/libeagle/libjpeg.so.8.3.0
    • libpng14.so.14 -> /home/joe/libeagle/libpng14.so.14.8.0
  6. Before running the Eagle installer or the Eagle software set environment variable LD_LIBRARY_PATH to include this directory (eg export LD_LIBRARY_PATH=/home/joe/libeagle )
Enjoy!

Update (30 Jan 2012): I received some improvements to the script from Leandro (wisleca@gmail.com).  Revision 2 is here.

Tuesday, December 13, 2011

Time tagging data streams using a short bash script

I've often had to write Arduino sketches and small PIC programs to read data from sensors for transmission to a PC over the serial link. This is mostly for testing and evaluating sensors in the lab – so I don't want to waste any more time than I have to writing software.  

A common requirement is to have each sensor record time tagged. However implementing a real time clock on a Arduino, PIC etc can be a lot of hassle. It makes more sense to tag the record on the PC as it comes in.

Here is a short bash shell script that runs on a Linux PC which reads data from an input stream (usually the serial port) line by line and prefixes each line with the unix epoch time (seconds since 1 Jan 1970):

#!/bin/bash
while read line ; do
    echo `date +%s` $line
done


So, for example, right now I have an Arduino sketch polling a SHT75 temperature humidity sensor. The Arduino is writing a record (about 1 every second) with the current temperature and humidity. The data looks like this:

19.70 49.22
19.70 49.38
19.68 49.38
19.66 49.22


This is coming in on /dev/ttyUSB2 in this case. The above script is in file timetag.sh. On the PC I do:

cat /dev/ttyUSB2 | bash timetag.sh > sensor.log

sensor.log looks like this:

1323808719 19.70 49.22
1323808720 19.70 49.38
1323808721 19.68 49.38
1323808723 19.66 49.22


The data can now be plotted with the insanely useful gnuplot utility like this:


$ gnuplot

set title "Temperature and Relative Humidity from SHT75 sensor"
set grid
set xlabel "Time"
set ylabel "Temperature (C) / Relative Humidity (%)"
set xdata time          # X axis is time
set timefmt "%s"     # Input file time format is unix epoc time
set format x "%R"   # Display time in 24 hour notation on the X axis
plot 'sensor.log' using 1:2 title 'T', 'sensor.log' using 1:3 title 'RH'

If you don't like the unix time notation, you can use alternative notations. See the manual page for the unix date command to get alternative time formats. You'll need to match the date format with the gnuplot 'set timefmt' command (help timefmt inside gnuplot will display available formats). For plots spanning more than one day you'll need to adjust time labeling with 'set format x' command (help set format time_specifier will provide information on this).

Sunday, December 11, 2011

Quick and dandy BusPirate breadboard connector

I have found that the probe kit that I had ordered from SeeedStudio with my BusPirate last year wasn't as useful as I had hoped. The quality of the the probe connectors wasn't great and having 10 probes in a bunch when all you need is 4 can be cumbersome. I can't complain – the probe kit was only $5.

I needed to check out a I2C temperature/humidity sensor with the BusPirate on a breadboard. So hacked this connector comprising a short length of 10 wire ribbon cable, a 5x2 IDE IDC connector to mate with the BusPirate IO header at one end and an IC socket at the other end.

The IC socket can then be plugged into the breadboard. I don't expect this connector to last forever, but it's certainly neater and easier to use than the probe kit.


Friday, November 25, 2011

A water drop microscope with a smart phone camera

I took this photo of a HTC Desire AMOLED display a while ago with a USB microscope. It has insufficient resolution to see the individual sub pixels clearly. But by adding a drop of water onto the display glass, the subpixels come into clear view.

Which got me thinking: what if I put a drop of water onto the camera window: would the camera become a microcope?

And indeed it does. The quality isn't great, but you can certainly see things that are not visible with the naked eye.

The trick is to ensure that the drop is small enough so that the entire surface is curved. A large drop will have a mostly flat surface and will not act as a lens. Objects will come into focus at a very short distance from the water drop lens – about 5mm.


Using the front facing camera on some of the newer camera models (eg the Galaxy Nexus) has the benefit that you can easily illuminate the subject while viewing the display. The normal camera can be trickier to get good photos because the camera blocks the light needed for a good exposure. The flash doesn't work very well because the subject is so close to the lens. If the subject matter is semi-transparent (eg a leaf) you can try back lighting it. When finished dry and clean the camera window with a soft cloth.


Here are some photos I took (some with the Galaxy Nexus, some with Galaxy Tab).

A microscopic photo of a HTC Magic LCD display through the water drop.
Holly leaf back lit with a desk lamp.

The pins of a TQFP IC package. The width of the pin is 0.22mm.

A holly leaf back lit by a desk lamp.
Finger tip.
Leaf, back lit by a desk lamp. Cropped and some sharpening applied.
PCB vias.

If you have any suggestions on how to improve the quality of the images or would like to share some of your microscope images, please leave a comment at the end of this post. More photos from this online album.

Updates:

27 Nov 2011: It occurred to me that oil has a higher refractive index than water (1.47 for vegetable oil vs 1.33 for water) which might result in better magnification. I'll try it at some point, but it will certainly be messier to clean up.

Monday, November 14, 2011

Roaming bandwidth in Spain with the Samsung Galaxy Tab

There seems no end in sight to the roaming ripoff in Europe. While the situation is improving slowly it's still ridiculous.

At the moment I'm on holiday in the Canary Islands (part of Spain). Before travelling I checked with my operator (Vodafone IE) re data roaming packages. The best they could do is €12 per day for 50MB after which €1 is charged per additional MB (down from €5/MB a few years ago!). I need about 100MB per day so that's €12 for the first 50MB and €50 for the next 50MB: a total of €62 per day, or €620 for a 10 day trip! Added to this is the complication that between myself and the wife we have 6 WiFi devices (2 x laptops, 2 x smartphones, a Kindle and an Android tablet). Our hotel WiFi is locked to a single device, is expensive, slow (128kbps?!), and is only accessible in certain areas (not our rooms).

I found a nice solution. I purchased a pay-as-you-go SIM from a local Vodafone shop (a €9 once off charge and you'll need photo ID to make that purchase). I then applied a data top-up to that SIM: €15 for 1GB lasting one week or €20 for 1GB lasting up to a month. I inserted the SIM into my Samsung Galaxy Tab 10.1v and started the portable hotspot mode (under Settings -> Wireless & networking -> Tethering and portable hotspot -> Portable WiFi Hotspot). Bingo: a portable WiFi hotspot good for up to 5 devices.

The Galaxy Tab's battery life is sufficient that I can carry the tablet in my day bag and have enough power to keep all our devices continuously connected no matter where we were. The Galaxy Tab has security disabled by default: I'd strongly recommend enabling security to prevent others nearby gaining unauthorized access to precious bandwidth (the mobile network here is good... it won't take long to download a full 1GB).

There are still a few problems (which I'm sure there are good solutions out there): Android 3.0 (Honeycomb) installed on the Galaxy Tab 10.1v (aka GT-P7100) seems to have no ability to report current or historical bandwidth use. I believe this has been addressed in Android 4.0 which I eagerly look forward to. Also I haven't figured out how to get remaining data credit on my SIM. And finally Windows 7: in the first few minutes after connecting it seems to go through megabytes per minute: presumably software updaters phoning home, Facebook, GMail brower windows fetching updates etc. It seems to settle down to a  reasonable rate after a minute when about 5MB is consumed.

Monday, October 31, 2011

Weather radar animation

Here is a short weather radar animation I made of a 24 hour period last week (24 October 2011) when the east coast of Ireland (Dublin city in particular) was deluged with an exceptionally heavy rain storm.


I made this video clip starting with a directory of individual radar images in PNG format and then used the mencoder tool (part of mplayer) to generate a MP4 video clip from the frames.

mencoder mf://*.png -mf fps=5:type=png -ovc lavc -lavcopts vcodec=mpeg4 -o video.mp4

Note that I've set the frames per second to 5 (fps=5). The usual 24 frames per second is too fast.

Images from Met Éireann (the Irish Meteorology service). 

Friday, October 21, 2011

Horologium Romanum


Despite the Roman Empire’s  sanitation, medicine, education, wine, public order, irrigation, roads, fresh-water system, and public health: they never had a decent digital clock. Well here it is!

The following video shows the clock in action. The clock is speeded up by over x100 so you can see a full 12 hours in just a minute or two.


The project uses only components that were available in the 1970s, 74 series chips, LEDs and resistors and a 50Hz or 60Hz clock signal.

There is plenty of support in the 74 series logic chips for driving 7 segment displays and Nixie tubes. But it seems nobody ever thought about developing a roman numeral driver chip! (I wonder why :)

I’ve broken this project into several segments and will describe each in turn:

  • Derive a pulse per second from clock source (divide by 50 or 60)
  • Count 60 seconds to obtain minutes
  • Count minutes and display in roman numberals (0 to 59)
  • Count hours and display in roman numerals (1 to 12)

For the display I opted to make the roman numeral letters using LEDs out on a breadboard: crude but adequate to illustrate the logic in action. If there was no limit to my time or budget I would have liked to have crafted something more elaborate.  Neon tubes would have been fantastic but way beyond my budget.

Decoding roman numerals

Before describing each segment, a little background on roman numerals. Here are numbers 1 - 60 laid out in a table.


On close inspection it can be seen it’s rather systematic. The important observations are this: we are only dealing with digits 0 - 59 and and the 0 - 9 of the 10s digit can be substituted for (blank),”X”,”XX”,”XXX”,”XL” and “L” respectfully, and the 0 - 9 of the units digit can be substituted for (blank),”I”,”II”,”III”,”IV”,”V”,”VI”,”VII”,”VIII”,”IX” respectfully.

For the units display I'm going to use 7 display elements which I'll call I3, X0, V0, I2, I1, I0. For the 10s display I will use 4 display elements: X3, X2, X1 and L0.

An important aid in decoding roman numberals is to be able to count in ‘decades’. For this reason I chose the 74390 decade/bi-quintary counter. So lets look at the truth table for the numbers 0 - 9 with the 74390 in bi-quintinary mode. Shown here is the Qn pins on the counter and the desired state of the display.

Q0Q3Q2Q1I3X0V0I2I1I0
00000000000
10001000011
20010000011
30011000111
40100101000
51000001000
61001001001
71010001011
81011001111
91100110000

By visual inspection the following rules for driving the display can be deduced:

I0 = Q1 OR Q2
I1 =  Q2
I2 = Q1 AND Q2
V0 = Q0 XOR Q3
X0 = Q0 AND Q3
I3 = Q3

And now the 10s display. The task is simplified because we're only interested in counting up to 59.

Q0Q3Q2Q1X3X2X1L0
000000000
100010010
200100110
300111110
401000011
510000001

L0 = Q3 OR Q0
X1 = Q1 OR Q2 OR Q3
X2 = Q2
X3 = Q1 AND Q2

Dividing 50Hz to get one pulse per second

For this project I'm using a timing signal derived from the mains frequency (although for prototyping I've been using an Arduino which allows me to experiment with various frequencies). In Europe and many other parts of the world this is 50Hz.  To get one pulse per second this signal will need to be divided by 50. This is easy with the 74390: either divide by 5 and then by 10, or vice versa. All else being equal I think it's a good idea to reduce the working frequency as soon as possible, therefore I opted to divide by 10 first, and then by 5.


Decade counter 1 (on the left) divides the incoming 50Hz signal by 10 bring the frequency down to 5Hz, and then decade counter 2 (on right) then divides it by 5 bring it to 1Hz.

You say tomato, I say tomato...

In the US the mains frequency is 60Hz which complicates things a little. Thankfully it's not difficult to fix. Connecting 2Q0 AND 2Q1 will cause decade counter 2 (on right) to reset at 6, thereby dividing the incoming frequency by 60.

Dividing seconds by 60 to get one pulse per minute

This is identical to the US mains 60Hz problem described in the previous section. I use a 74390 and tie the MR (reset) of decade counter 2 to 2Q0 AND 2Q1. The Q0 pin forms the input to the minutes counter.


The Minutes Counter and Display Decoder

This purpose of this segment is to count minutes from 0 to 59 and then roll over to 0. It also decodes the counter output pins (1Q0 to 3 and 2Q0 to 3) to drive a roman numeral display. Decade counter 1 (on left) counts minutes and decade counter 2 (on right) counts the 10s of minutes. The roll over at 60 is accomplished by feeding 2Q1 AND 2Q0 (ie 6 on the 10s counter) to the counter reset.

The Hours Counter and Display Decoder

The hours count from 1 - 12 which is a problem: the 74390 has no preset capability: it's always all 0s on reset. So how to get the clock to roll over to value 1?  This took a bit of thinking and I (eventually) came up with a solution that involved two D flip-flops (7474) in series.

The first D flip flop delays the falling edge of 2Q1 by one clock cycle and the second flip flop delays it by a further cycle. By ANDing  Q bar of the first flip flop with Q of the second flip flop I get a pulse which is delayed by one clock cycle. I then OR that to the input of the hours counter and it creates an second short pulse whenever the clock rolls over.. causing the clock to start at a count of 1.


Photos


Conclusion

This is really just a proof-of-concept which was prototyped using a breadboard. However the electronics checks out and could form the basis a more permanent project.  I had some ideas on ways of (safely) tapping into the mains 50/60Hz signal to get a high precision clocks signal. Modern power utility networks control the frequency to a very high degree of accuracy (if averaged over 24 hours) and is as good as typical quartz crystal solution. Unfortunately I've run out of time. I might follow this up in a separate post later if there is interest.

Also I ran out of time on the clock setting function, which is a pity, because it's important :) This was going to be implemented by feeding the pulse-per-minute output from the seconds counter together with the output of a microswitch to a XOR gate and then forwarding the output of the XOR gate to the minutes counter.  This would allow the user to manually advance the minutes with each key button press (there may be need to debounce the switch). Ditto for the hours counter.   An alternative approach is use a microswitch to feed the 50Hz clock signal to the seconds stage, advancing the clock at high speed while the switch is depressed.

The bill of material:
  • 4 x 74390
  • 4 x 7408 (AND gates)
  • 2 x 7486 (XOR gates)
  • 3 x 7432 (OR gates)
  • 1 x 7484 (D flipflops )
  • LEDs (lots, about 70 + limiting resistors)
  • 50Hz (or 60Hz) signal generator (using Arduino for prototype)
  • 5V power supply (using Arduino 5V power supply)


The Arduino sketch to generate the 50Hz signal is:

void setup() {               
  pinMode(13, OUTPUT);    
}
void loop() {
  digitalWrite(13, HIGH);   // set the LED on
  delay(10);
  digitalWrite(13, LOW);    // set the LED off
  delay(10);
}


Wednesday, September 28, 2011

Controlling XBee IO lines with ZigBee commands

Summary: this post explains to send remote AT commands to an XBee module using ZigBee commands. The end point, profile ID, cluster ID and command and response format is documented. This is useful if you need to control a XBee's IO lines from a non-XBee device.
The Digi XBee Series 2 module. 
The Digi XBee module is a popular RF module featuring a UART and several IO lines that can be configured as input/output or in some cases ADC or PWM. The "Series 2" version of these modules can be flashed with ZigBee compatible firmware. The modules then participate in a ZigBee mesh network.

The modules are configured and controlled by  AT commands (like the modems of old) which are issued through the module's UART by a computer or microcontroller. There are two varieties of the firmware: AT mode and API mode. The latter provides access to more advanced features of the module.

One feature of the API mode is the ability to send AT commands to remote XBee modules. This can be used to control relays, read the state of switches, read temperature etc. This in theory allows many small control applications to be accomplished with nothing more than a XBee module on it's own -- no need for an attached microcontroller.

There is a problem however. All the examples and documentation I've seen to date (I may very well have missed something, but not for the lack of trying) only cover controlling a XBee module through the XBee API. So if your interface to the ZigBee network is not a XBee (or equivalent Digi product) you're out of luck. In my case I have a Texas Instruments CC2530 based USB dongle and I require that software running on a computer control the state of a remote XBee's IO lines.

So, reverse engineering time! I wrote scripts to control the XBee digital IO lines from another XBee, and simultaneously ran a 802.15.4 packet sniffer. This is what I learned:

For remote AT commands the sending XBee issues a ZigBee command to the remote XBee on endpoint 230 (0xE6), with profile 0xC105 (Digi private profile), cluster 0x0021. The command is formatted as follows:

0x00, 0x32, 0x00, frame-id, sender-ieee-addr, 0x00, 0x00, atcmd0, atcmd1, [param]

frame-id: one byte API frame ID used in many XBee API calls
sender-ieee-addr: the 64 bit IEEE address (8 bytes, the most significant byte first)
atcmd0: the ASCII code of first character of the AT command (eg 0x4d or 'M' if command is ATMY)
atcmd1: the ASCII code of the second char of the AT command (eg ...)
params: zero, one or more optional parameter bytes

For example: to send ATMY (get 16 bit network address) the command will be:
0x00, 0x32, 0x00, 0x0f, 0x00, 0x13, 0xa2, 0x00, 0x40, 0x3c, 0x15, 0x5c, 0x00, 0x00, 0x4d, 0x59

The bytes with values 0x00 and 0x32 may have some significance, but I have no idea what it might be. I'm not sure if the sender IEEE address is important. It seems to work the same no mater what address I use.

Responses are sent on cluster 0x00a1. In response to the ATMY command I get:
0x0f, 0x4d, 0x59, 0x00, 0xd1, 0xed

So that seems to be:
frame-id, atcmd0, atcmd1, 0x00, atresponse...

The XBee digital IO lines are configured with the ATDn commands, where 'n' is the number of the IO line. The lines can be configured as input, output low, output high, analog and PWM (not all lines are capable of all the functions). The two functions that are of interest to me are output high (parameter value 5) and output low (parameter value 4).

Note: there is potential for some confusion encoding AT commands. Take for example the command ATD04. What this means is AT command D0 with parameter 4.  The digit 0 in the command part is encoded as the ASCII code ie 0x30, but the digit in the parameter part (4) is the byte value 0x04. So the command and parameters is encoded as 0x44, 0x30, 0x04.

Other clusters in endpoint 230 have other functions, which I'll document in another post.

Update (2 Oct 2011): Small edit. I omitted the frame-id in the format of the AT command response.

Thursday, September 15, 2011

Irish electricity use and wind generation, 2001 - 2011

In response to a chart I posted earlier this week on the Irish national electricity grid wind production, I got a few queries which would suggest that people are not familiar with that electricity demand looks like. So here are a few charts which will hopefully provide some insight. I’m not an expert on this topic, so I’m not going to say much other than present some pretty charts.

First this is what demand looks like throughout the day. There are differences between summer and winter demand. Being a country where air chilling is rarely needed, a significant proportion of power is consumed by heating, but very little by cooling. So as expected average use during summer is less than winter. Night use is way lower than day use (no surprise there). In winter however, between 17:00 and 19:00 there is peak. This is presumably due to people coming home from work and switching on heating. This peak is a problem as it often stretches the Irish grid to its limits during the winter.


The following chart is a typical week. There is a clear difference between weekday and weekend use levels.

As mentioned earlier summer demand is lower than winter. Right in the middle of winter is the Christmas and New Year holidays which disrupt the usual patterns.


Over 10 years one can see a steady increase in electricity demand up to the recession in 2008. Wind generation really started to take off in 2005.

Here is the same 10 years of data displayed in oscilloscope style (one week per frame).


I believe there was a time where individual events were clearly visible in the demand charts. For example in the 1960s the RTÉ (the national broadcaster) could estimate the 'Late Late Show' viewing figures from spikes during ad breaks (tea, kettles...) [can't find any refs for this]. Nowadays there is so much power being consumed that it's very rare to see any individual event in the data. I did spot one exception which I assume had something to do with the events in the US on 11 Sep 2001. But how exactly that translated into a significant spike at about 12:00 the next day, I don't know.


The data is provided by EirGrid (the state-owned electric power transmission operator in the Republic of Ireland). The system demand definition is stated as “production required to meet national electricity consumption, including system losses, but net of generators' requirements.  It includes power imported via the interconnector and an estimate of the power produced by wind generators, but excludes some non-centrally monitored generation (i.e. small scale CHP).”

Thursday, August 25, 2011

Removing SMD chips with Chip Quik

I accidentally blew the JTAG fuse on a MSP430 MCU recently. Unlike PICs this is an irreversible operation. The onboard firmware does not have a bootloader, so the only way to upgrade the device is to replace the MSP430 chip.

I considered using hot air, but the chip is very close to a CC2520 radio chip (QFN package) and a PIR sensor, neither of which I want to expose to much heat. While researching alternative techniques I stumbled across Chip Quik. At €15 (available from Mouser and Farnell/Element14)  I figured it was worth giving it a try.

Basically this is low melting point solder. It takes long enough to solidify that you have enough time to wet all the pins and push or lift the chip.

The kit comes with about 1m of this special solder wire, a tube of flux and alcohol wipes to remove the flux residue.  The procedure is simple: apply flux to the pins. Then apply this solder. Run the soldering iron around all sides and just push or lift off the chip.

This is a video I recorded from my USB microscope of my very first practice run. The board is a controller from an old 3.5in floppy drive.


It works as advertised! I was surprised at how easy the chip lifted off. The next step which I didn't show is to clean off the pads with soldering wick. Then use the supplied alcohol wipes to clean the flux residue from the PCB (and the chip if you need it again).

What is this alloy? What is its melting point? The packaging made no mention of this. Being the curious type I got my Steinel heat gun and started at 150°C expecting to be working up the temperature scale. Instant liquid! 120... still liquid... 100 ... 80 ... 60 .. and finally at the 50°C it solidified. Wow... that's not much higher than the melting point of butter! Doing a bit of googling I found a page on their site which has some details: it's a bismuth, tin, lead and indium alloy with a melting point of 60°C (139°F).

Conclusion: if you need to remove a chip without disturbing neighboring components, this seems like great product to use.

Friday, July 29, 2011

Making your own bar code key fobs

My broken gym bar code fob
My gym uses bar code fobs which keep breaking.  So I made my own. Unlike RFID fobs it's trivial to make your own. Here is how I did it:
  1. Get the code 
  2. Identify the bar code type (the "symbology"). 
  3. Use a web app to make a bar code
  4. Print, cut and attach to your key ring 
The code is usually printed under the bar code. If not, you can use a smartphone mobile app such as ZXing to scan the code.  ZXing will also tell you what symbology is used. (Obviously if the fob is broken like mine, you'll need to hold the pieces together as best you can before scanning).

The bar code "symbology" is how the code is encoded into bars. You might get away with using the wrong symbology, depending on how the bar code scanner is configured. If you scanned with a app like ZXing it will tell you what the symbology is. If not, try making bar codes with all the different symbologies until you find a code which is visually identical to your broken fob.

Making the bar code

There are many free web pages and apps to make and print bar codes, but many produce output pages what are cluttered with unnecessary stuff. So I wrote my own little mini-app: http://barcodekeyfob.appspot.com/ based on the Barcode Coders library.

When you've got the right code, print and cut out and attach to your key ring. I'm using the reverse side of my Tesco fob. Do not cut the bar code too tightly: bar codes require white space (the "quiet zone") to the left and right of the code.


An improvised bar code key fob


It's not going to last forever, but heck, it can't be any worse than the ones the gym supply. In any case I printed a few spares so that I can quickly replace it. Of course it doesn't have to be a tiny fob. I'm thinking of printing an A5 sized version of the bar code, laminating it and attaching it to my gym bag.

Monday, June 27, 2011

Interfacing the TMP006 IR temperature sensor with the Bus Pirate

The TMP006 infrared thermopile temperature sensor 
Summary: This article explains how to interface the Texas Instruments TMP006 non-contact IR temperature sensor evaluation module (TMP006EVM) to a Linux computer using the Bus Pirate from Dangerous Prototypes. A small Java program has been written which queries the TMP006 registers using the Bus Pirate, calculates the object temperature and outputs to the screen. Some basic theory of operation is explained and a temperature vs time charts from a cooling mug of coffee and the sky at sunset is presented.

Texas Instruments (TI) recently announced the TMP006,  infrared thermopile temperature sensor – ideal for non-contact temperature measurements in the range -40°C to +125°C. The sensor costs just $1.50 in quantity. As with most TI parts, an evaluation kit (TMP006EVM) is available, but at the significantly higher price of $50.

The evaluation kit comprises two hardware components:
  • a TMP006 sensor mounted on a PCB module with a 10 pin header for I2C lines and power 
  • a SM-USB-DIG: a general purpose USB to I2C/SPI interface which TI use for other evaluation modules also.
The kit also comes with a USB memory stick with the evaluation software, plastic protective case/cover for the SM-USB-DIG and TMP006 module, a USB extension cable, and 30cm ribbon cable suitable for separating the SM-USB-DIG and TMP006 module.

The supplied software is based on National Instruments LabView and is Windows only. As one would expect from TI, it's easy to install (although it's over 100MB in size!), looks good and works well.

But I use Linux.

My first idea was to write a Linux driver for the SM-USB-DIG. This sub-project has advanced quite a bit, and thanks to a helpful post by a TI employee the protocol has been decoded.... but it isn't returning reliable data just yet.

To expedite matters, I have set the SM-USB-DIG aside for the moment, and turned to the handy Bus Pirate instead.


The TMP006 communicates with the world using I2C/SMBus. Four pins from the TMP006EVM module header (H1) need to be connected:
  • H1 Pin 1: I2C SCL  connects to the Bus Pirate CLK
  • H1 pin 3: I2C SDA connects to the Bus Pirate MOSI
  • H1 pin 6: Vcc (3.3V) connects to the Bus Pirate 3.3V
  • H1 pin 8: Gnd connects to the Bus Pirate GND.
 The TMP006 has 5 registers which can be queried or written to through the I2C bus:
  • Register 0x00: 16 bit signed voltage output from the thermopile (read only)
  • Register 0x01: 14 bit die temperature sensor (read only)
  • Register 0x02: configuration (read/write)
  • Register 0xFE: manufacturer ID (read only, always 0x5449)
  • Register 0xFF: device ID (read only, always 0x0060)
The object temperature is a function of the die temperature and the thermopile voltage output. It's not a simple function – some math is involved which is documented in the TMP006 Users Guide, page 10.

To test, connect to the Bus Pirate, enter I2C mode, select 100kHz speed (although slower speeds will be fine too), apply power to the 3.3V line ('W' command) and enter the following command:

[0x80 0xFE [0x81 r r]

All going well the following response should be received:

I2C> [0x80 0xfe [0x81 r r]
I2C START BIT
WRITE: 0x80 ACK
WRITE: 0xFE ACK
I2C START BIT
WRITE: 0x81 ACK
READ: 0x54
READ: ACK 0x49
NACK
I2C STOP BIT
I2C>

This command will read register 0xFE (the manufacturer code) and should return 0x5449.
The normal Bus Pirate interface is written with human interaction through a terminal emulator in mind. Which is great for debugging stuff, but not so handy if a computer program is to be controlling the Bus Pirate. Fortunately, for direct computer control, a binary mode is also available.

I wrote this Java program which uses the Bus Pirate's binary I2C mode to continuously query the TMP006 die temperature and thermopile voltage registers and calculate the temperature of the object in front of the sensor. The RXTX Java IO library is required (available as the librxtx-java package in Ubuntu).  [I can re-write this for Python or C. Leave a comment at the end of the post if you're interested in seeing this implemented in another language].

Compiling and running the Java program:

javac TMP006.java

java TMP006  /dev/ttyUSB4 > tmp006.dat

Replace /dev/ttyUSB4 with what ever device the Bus Pirate is connected to. If all goes well you should see the data that looks like this in tmp006.dat (use tail -f tmp006.datto view the log file in real time.


1309198469685 65421 2956 23.09375 24.638878222595167
1309198471555 65422 2956 23.09375 24.66207367078897
1309198473401 65423 2956 23.09375 24.68526379750324
1309198475244 65420 2956 23.09375 24.61567745003481


The columns are:
  1. Time stamp (milliseconds)
  2. 16 bit value from register 0x00
  3. 16 bit value from register 0x01
  4. Tdie (degrees C)
  5. Tobj (degrees C)

This gnuplot command will generate a nice chart from the data:

plot 'tmp006.dat' using 1:5 title 'Tobj (C)', \
'tmp006.dat' using 1:4 title 'Tdie (C)'


Theory of operation

Every object emits a characteristic electromagnetic radiation called "black body radiation". The spectrum depends (among other things) on the object's temperature. This is the phenomenon that causes  'red hot' objects to glow a dull red and 'white hot' objects to glow bright yellow/white. Objects at human temperatures also glow, but in the far infrared part of the spectrum which is not visible to the human eye.


The above chart shows the black body radiation spectrum for melting ice (blue), human skin temperature (red) and a typical mug of coffee (green). The spectrum curves are derived using Plank's Law.  Also shown is the TMP006's area of sensitivity (4µm to 8µm [1][2]) and the location of the visible part of the electromagnetic spectrum.

The TMP006 measures the intensity of  IR radiation in the 4µm to 8µm region of the spectrum using the Seebeck effect. The measuring circuit built into the the chip/sensor converts the intensity of incident radiation into a voltage which is reported back to the application. Using this voltage, and the temperature of the sensor itself a good estimate of the temperature in front of the sensor can be calculated. The necessary equations are detailed in the TMP006 Users Guide, page 10.


Two things to note. The sensors field of view is a solid angle extending 30 degrees from the normal. Beyond that the sensitivity falls off sharply. Also it is assumed that the emissivity of the target object is reasonably high (> 0.7). Objects such as wood, skin, water and generally anything that's not very white or shiny has a high emissivity and can be measured this way.  To get a good reading on shiny metal surfaces that have very low emissivities, it's recommended to cover the area being measured with black tape or paint a patch with black paint.


Some results

This is a chart of the measured temperature of a mug of coffee left cooling. There is approx one temperature sample taken every second. As one would expect, this is a classic Newtons Law of Cooling curve.

This next chart is a temperature vs time chart of the sensor looking up at a cloudless sky (a rare day in the west of Ireland!). I was a little surprised by the results: I expected to see colder temperatures. My other IR thermometers report temperatures well below 0°C when pointing at the sky (away from the sun). Some buildings were in the sensor's field of view which might explain the higher than expected temperatures.

Conclusion

The TMP006 looks like a useful sensor. Looking at TI's promotional material for it, it would seem that they have the mobile devices market in mind. Being able make an instant temperature measurement would certainly be a useful feature for high end smart phones. Also it has a digital interface removing the need for analog signal conditioning and ADC, thus simplifying design and reducing component count.

The volume price of just $1.50 seems very reasonable. Unfortunately the tiny 1.6mm square WCSP (Wafer level Chip Scale Package) and the stringent PCB layout guidelines [3] make this device difficult to use unless you have access to a advanced surface mount soldering workshop. Hopefully this sensor will be available on a breakout board in the near future.


Footnotes and references

[1] TMP006 Users Guide (SBOU107), page 2.

[2] Discussion on TMP006 at TI forums
http://e2e.ti.com/support/other_analog/temperature_sensors/f/243/t/117229.aspx

[3] TMP006 Users Guide (SBOU107),  Layout Guidelines,  page 6.

Diagram on principles of operation taken from TI promotional material.

Tuesday, June 21, 2011

The day GPS Selective Availability (SA) was switched off

I was going through some old archived projects recently and came across an interesting GPS track log I recorded on 2 May 2000.

For us GPS early adopters, this was a remarkable day: the day GPS became truly useful for terrestrial applications. I had left my Garmin GPS35 logging to capture the event, and here it is:


It may seem that the GPS was violently oscillating about the place and then stopped half way through the period of time recorded on the chart. Believe it or not it was completely stationary for the entire duration! So what happened?

First a little GPS history. GPS was conceived by the US military as an exclusively military navigation aid in the early 1970s.

In September 1983, Korean Airline Flight 007 was mistaken for a hostile military aircraft by the Soviets when it accidently strayed into their airspace. It was shot down with the loss of 269 lives. Following that disaster it was decided that GPS would be made available for civilian use to prevent such tragedies from happening again.

Naturally the military were concerned that the super accurate navigation provided by GPS could be abused. To address these concerns two signals were transmitted: one for military receivers with the full 10m accuracy, and a separate signal for civilian receivers with about 100m accuracy. 100m was considered adequate for aviation and marine applications at the time (but not accurate enough to allow a missile to hit a target). This degraded signal was known a Selected Availability (SA).

During the 1990s with the end of the cold war and an increasing civilian use of GPS the thinking at the US government was that the economic and safety benefit of removing SA far outweighed the risks.

So on 1 May 2000, the White House issued a press release announcing the end of SA with the following quote attributed to President Bill Clinton:
"The decision to discontinue Selective Availability is the latest measure in an ongoing effort to make GPS more responsive to civil and commercial users worldwide…This increase in accuracy will allow new GPS applications to emerge and continue to enhance the lives of people around the world."
Right on cue, on 2 May 2000 the SA was disabled and that moment was caught here. Only longitude is displayed for clarity, but latitude and altitude would have been oscillating with a similar amplitude. And a big difference it made, opening up a mass market for consumer GPS devices.

[Aside: SA was temporarily removed at some point [can't find a date] during the first Persian Gulf War in 1991 because of a shortage of military GPS receivers. Instead civilian units were used. These were just as accurate with SA switched off. SA was restored again on 1 July 1991.]

References:
http://ngs.woc.noaa.gov/FGCS/info/sans_SA/docs/statement.html

Updates:

27 Dec 2018: I thought I had lost the original data file, but found it a few days ago on an old archive CD-ROM while cleaning for Christmas. I created a better chart showing both east-west deviation and also a north/south deviation as function of time.    Data and Gnuplot source files are available here: https://github.com/jdesbonnet/GPS_SA_switch_off

Tuesday, May 24, 2011

Arduino to Android IO on the cheap (aka Poor Man's NFC)

Summary: This article describes how to implement a very low bandwidth one way communication channel between an Arduino (or any other microcontroller) and an Android device using nothing more than about a meter of magnet wire, a resistor and diode. Links to a software sketch for the Arduino and the Android source code is included.

A cheap and simple way of communication between a microcontroller (eg Arduino) and an Android device is surprisingly difficult to achieve. The most practical means of accomplishing this is to use a Bluetooth or WiFi module adding significantly to the cost of a project (in the order of $30 - $60).

This is a little hack that allows very low bandwidth communications in one direction for practically no cost. It's not practical for most applications, but I thought the idea was sufficiently interesting to explore and write up in a blog post.

You'll need the following:
  • An Android phone or device which features a magnetometer (electronic compass). I'm not aware of any device without one.
  • An Arduino or other microcontroller (my examples are for the Arduino)
  • About 1 meter of  enameled copper wire (magnet wire), although any thin insulated wire will do.
  • The Android 'Tricorder' app (available free from the Android app store)
  • A 120 ohm resistor 
  • A diode (optional)
Make a coil by wrapping the 1 meter of magnet wire around something cylindrical  (eg AAA cell) with a diameter about 1cm. You should get about 30 turns from 1 meter. The diameter or number of turns is not important as long as they are in that ball park. Wrap a light thread around the coil to help keep its shape.


Connect the coil as illustrated in the schematic above. The 120 ohm resistor limits current draw to about 40mA which is the maximum allowed [1]. The purpose of the diode is to protect the Arduino from an EMF kick when pin 13 is driven low. This is known as a  flyback diode. With only 30 turns and an air core, you'll probably get away without using it. But it's good practice to include it.

Tricorder app displaying magnetic field. For the
HTC Desire the signal is strongest at the bottom
left of the LCD where the magnetometer is located
This is likely to vary from device to device.
Now to locate the magnetometer. It's location will vary from device to device. This is where the tricorder comes in handy. First load this sketch on the Arduino before you connect the coil.


/**
 * Generate 1Hz square wave on pin 13
 */
void setup() {
  pinMode(13,OUTPUT);
}

void loop() {
    digitalWrite(13,1);
    delay(500);
    digitalWrite(13,0);
    delay(500);
}


When the coil is disconnected you should see the Arduino's LED blink. Now connect the coil. The LED should stop blinking at this point because the coil shorts the LED -- this is expected. Start the Tricorder app and switch to MAG mode and start scanning. Methodically scan the coil across the surface of the Android phone until you start seeing a strong square wave. Where the amplitude of this signal peaks is where the magnetometer is located. You should see a similar square wave if you position the coil at the same location on the bottom surface of the device. Use some tape to keep it positioned there.

Now we have a way of signalling the Android. The temptation at this point is to connect the coil to the Arduino UART and to start firing data at 9600bps. Unfortunately this isn't going to happen for a few reasons:

We are limited by the magnetometer sampling rate available to us by the Android OS. Here is a histogram of time-between-samples from a HTC Desire running Froyo (Anrdoi 2.2) at maximum sampling speed:


We can see here that almost all the samples come in at between 18ms and 25ms. There are a few outliers going all the way up to 45ms but there numbers are so few we can ignore them. This means we are limited to a maximum of a 40Hz sampling rate. If we drive the coil with a digital IO line that immediately caps our maximum bandwidth at 40bps.

But does the magnetometer respond quickly enough?

This Arduino sketch energizes the coil with a square wave of starting at 500Hz and decreases to about 1Hz over a few seconds.

int i;
int d = 1;
void setup() {
  pinMode(13,OUTPUT);
}

void loop() {
  for (i = 1; i < 500; i+=d) {
    
    // Increase increment as frequency decreases
    d = (i>>6) + 1;
   
    digitalWrite(13,1);
    delay(i);
    digitalWrite(13,0);
    delay(i);
  }
}


Here is the magnetometer data:

As expected high frequencies (on the left) are not be detected. It seems that we only get good pickup when the frequency drops to about 6Hz!

For encoding I'm going to use NRZ (non return to zero) similar to that used in RS232 with a bit period of 140ms (about 7 bps). The Arduino's UART lower limit is 300bps, so I can't use it to generate the signal.  So I'm going to 'bit bang' the signal in software. Likewise, on the Android I'm going to have to decode in software also.

#define BIT_DELAY 140

int i;
char *text = "Hello World! ";

void setup() {
  pinMode(13,OUTPUT);
}

void loop() {
 
  char *s;
  s = text;
  while (*s != 0) {
    transmitByte(*s++);
  }
  
  delay (BIT_DELAY*10); 
}
/**
 * Bit bang a byte
 */
void transmitByte (byte c) {
  
  // Start bit
  digitalWrite (13,1);
  delay(BIT_DELAY);
  
  // Data bits
  for (i = 0; i < 8; i++) {
      digitalWrite (13, ( (c&0x80)!=0 ? 1 : 0) );
      delay(BIT_DELAY);
      c <<= 1;
  }
  
  // Stop bit
  digitalWrite (13, 0);
  delay(BIT_DELAY);
}

Here it is in action:


The Android source is available here.

Potential improvements


My simple example uses a digital IO line to drive the coil. The Android magnetometers typically have at least 8 bits of resolution per channel [2]. It may be possible to squeeze another few bits per symbol by driving the coil with a DAC [3]. For example, 4 power levels can be used to encode 2 bits per symbol. The odd bit error  can be corrected using forward error correction.

Also the magnetometer has three channels (X,Y and Z). It may be possible to construct a set of coils that excite the X,Y and Z channels independently … multiplying bandwidth by a further x3. Another thought: I've only discussed digital communication with the Android. Some applications might only require an analog signal.

These ideas are left as an exercise for the reader, but I’d love to hear how you get on if you try it. 

Footnotes


[1] Googleing "Arduino pin 13", one is lead to believe there is a current limiting resistor in series with the MCU pin. However looking at the schematics, the tap for the pin 13 header comes *before* the resistor: so the resistor does not limit current. I only discovered this at the end of the experiment while proofing this post. Omitting the resistor did me no harm, but would advise to include the resistor to be safe. We need as much current as possible (more current means more magnetic flux in the coil). The Arduino Duemilanove datasheet specifies a maximum draw of 40mA on a IO pin, so 120 to 150 ohms should do the trick. If you need more current you'll need to use a transistor.

[2] The HTC Desire uses a AKM Semiconductor AK8973 3-axis magnetometer which uses a combination of a 8 bit ADC and a 8 bit offset DAC to yield up to 12 bits of equivalent resolution spanning +/- 2000µT of magnetic flux.

[3] The Arduino does not have a true DAC, however DAC functionality can be achieved by passing the PWM output through a low pass filter.

Thursday, May 19, 2011

Changing Mimetex fonts

An example of Mimetex in action
Mimetex is a handy little add-on for web applications that will render math expressions in TeX/LaTeX syntax and convert them directly to GIF images. It's just one binary executable file which is normally deposited into the "/cgi-bin" directory of the web server. Everything is compiled into the executable, including the fonts. Which is nice: no configuration... no font directories... Simple!

The mimetex distribution comes with the default Computer Modern fonts built in. I was recently asked to change these fonts to a sans-serif font. In case anyone else needs to do something similar I'm documenting what I did in this post.

I'm assuming a Ubuntu Linux distibution (although it should work with other Linux/BSD distros) and you'll need a full TeX/LaTeX distribution installed.

Then download this script. It's good practice to review it first before running it.

The script will:

1) Download Mimetex (if you have not already done so)
2) Render the sans-serif version of Computer Modern to a format that can be used by mimetex
3) Patch mimetex.h to use the sans-serif fonts instead of the default Computer Modern font
4) Compile a new mimetex binary executable file

The results?

Before:

After:

What's going on under the hood?

The starting point is a Metafont description of the new font. Fortunately there is a sans-serif variant of computer modern available in Metafont format (cmss and cmssi) included in the TeX distribution.

The process of adding new fonts involves rendering the Metafont file into a bitmaps (.gf) files. Those binary .gf files are then converted into a ASCII printable format using "gftype -i" and then the gfuntype utility (shipped with Mimetex) will convert that to a C header (.h) file. The fonts are run off at various sizes and all the resulting .h files are concatenated together to form 'texfonts.h' which is compiled into the executable.

Is it possible to compile in Type1?

As far as I can tell, there is no easy way to use fonts in formats other than Metafont. And I can't find any way to convert Type1 and other formats to either Metafont or the intermediate .gf bitmap files. I'd be delighted to hear about any suggestions if this is possible.

Also it should be pointed out, there are probably better alternatives to Mimetex available nowadays, eg Mathtex and Mathjax.

Saturday, April 16, 2011

'Smart' electricity meter based on Efergy Elite monitor, part 2

Summary: In part 1, I documented the Efergy Elite’s radio protocol and wrote a PIC program that ran in a tight loop decoding the data and sending it to a serial port. This post improves upon the decoding technique used allowing for other applications (eg temperature monitoring) to multi-task on the same PIC. A simple control loop multitasking framework using interrupts to capture time critical events is explained.

The ultimate goal of this project is a electricity consumption monitor that provides real time feed back and also logs historical power use for analysis and report generation. For the moment my focus is feeding the data to a PC/laptop. In reality a more power efficient logging device will be needed. But that's for a future post.

Recently I wanted to update this receiver to include data from temperature sensors and output data from both the Efergy Elite and the temperature sensors to a single serial port.

However the tight timing loops which are continuously running make it near impossible to perform any other task. Fortunately the PIC has lots of useful hardware that can be brought to bear on this problem. Timing pulses with a loop is rather clumsy, inaccurate and wasteful of system resources. Almost all PICs have timers and interrupts which can be used for this task.

By using this peripheral hardware a lot of the decoding grunt work can be happen silently in the background, freeing up the CPU for other stuff.

Simple Multitasking with a PIC


Although not a proper multitasking processor such as a Pentium, a very simple form of multitasking can be easily achieved with a PIC. This comprises a master loop which calls application service routines for each application in turn. This is often called “simple control loop multitasking”.

The application service routines check to see if there is any work to be done. If not it immediately exits and the control loop then pass control the the next application service routine. If there is work to be done, the application service routine attempts to tackle as much as can be achieved in it’s allocated time. If all the work cannot be completed in time, it must relinquish control prematurely and continue the task on the next call.

void main (void) {

  // Initialize apps
  initAppA();
  initAppB();
  initAppC();
  initAppD();

  // Main loop
  while (1) {
    appA();
    appB();
    appC();
    appD();

    // Clear watchdog timer
    CLRWTD();  
  }
}

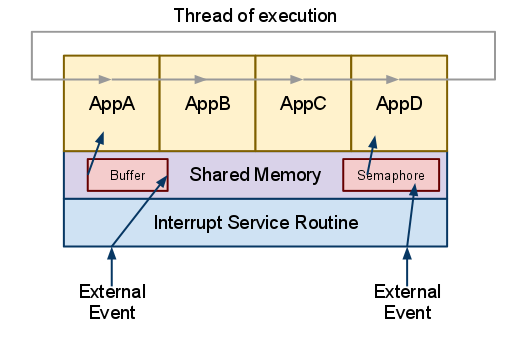
Architecture diagram of simple control loop multitasking with interrupts used to capture time critical events.


In order to be responsive the main loop must iterate many times a second. The iteration frequency will depend on the nature of the application(s). 1kHz is a common choice. At 1kHz the entire loop must complete in 1ms and each app service routine must take no more than 250µs (assuming there are 4 applications requiring equal CPU time).

These routines must be written so as not to use more than their allocated time slice. If a task cannot be accomplished in that time frame it must be broken into smaller work units.

Unlike a modern preemptive multitasking operating system such as Linux these constraints are not enforced. A badly written service routine will affect the performance of the entire system. For example a deadlock in one application will cause the entire system to fail. One safeguard against rogue applications is to enable the Watchdog Timer and clear it on each iteration of the loop. Should one application lock up the system will reset.

Interrupts can be used to capture time critical events. The ISR (Interrupt Service Routine) is called (almost) the instant the event occurs. Its job is to store the event for the attention of the application service routine whenever it gets control of the processor. It’s often a good idea to buffer these events in case more than one arrives before the service routine gets its turn to run.

Efergy Elite decoding


A quick recap on the Efergy Elite setup. A sensor mounted in the utility meter box transmits by 433MHz radio a power reading to the display unit every 6, 12 or 18s (configurable). On the display unit PCB I tapped into the radio base band output and connected this to a low cost PIC MCU. It does the job of decoding the signal and sending a nicely formatted record to the PC via serial IO.


Bits are encoded on the base band signal using digital FSK (Frequency Shift Keying). Three square wave cycles of 2ms duration in total (ie 1500Hz) is a logic 0 and 4 square wave cycles of 2ms duration (ie 2000Hz) is a logic 1.


Each packet is prefixed by a synchronization header of 0xAB 0xAB and 0x2D. This is followed by 8 octets (bytes) of data and one octet checksum. See previous post [link] for details.

The decoding process starts with the radio hardware which outputs the base band signal. Using pulse width measurements the symbols (bits) are decoded. First the bits are are shoved onto a 16 bit shift register until the end sync header is identified (ie the contents of the shift register will read 0xAB2D). Then 8 octets of data is read followed by one checksum octet (the checksum is the arithmetic sum of the 8 data octets).


The choice of what to implement in the ISR and what to implement in the application service routines is sometimes not clear. The rule of thumb is to keep the ISR as small and fast as possible. I had originally considered using the ISR to time pulses and send pulse durations to the application layer. As there can be as little as 250µs between pulses the entire main loop would have to execute in under that time. That’s only 250 instructions on a 4MHz clocked PIC. Not enough!

For just a few more instructions the pulse to symbol decoding can happen in the ISR thus allowing for up to 2000µs between application service routine calls.

To improve matters further, instead of storing one symbol at a time, I push the decoded symbols into a buffer (implemented as a 8 bit shift register) allowing for up to 16000µs between calls.

For the first attempt I connected the radio base band signal to the INT pin (RB0), traped INT interrupts and used Timer1 to measure the pulse widths. Timer1 is a 16 bit timer which can be clocked using the system clock divided by 4. If you’re using the 4MHz internal clock that’s a convenient 1µs per clock tick.

There are a few gotchas when using interrupts. For example: variables shared between the ISR and main program must be declared with the “volatile” modifier. When accessing state information which can be manipulated by the ISR, it is often necessary to briefly disable the interrupt while reading to ensure that an interrupt does not case the state to appear corrupted.

Measuring pulse width with INT interrupt.
The PIC can be programmed to trigger INT on a rising edge or falling edge. But not both at the same time. To measure pulse widths I’ll need both. The work around is to alternate the triggering mode.

I’m measuring inverse pulses (ie the duration of time when the signal is at low voltage). So when waiting for a pulse to arrive, set to trigger on a falling edge. In the ISR, record the clock and set trigger mode to rising edge. The next invocation of the ISR will occur at the end of the pulse. Subtract the clock from the previously recorded value -- that is the pulse width. Now reset INT to trigger on a falling edge again for the next pulse.

An alternative implementation using Capture/Compare


Microchip PICs have so much peripheral hardware that there is often several ways of solving the same problem. The Capture/Compare module is probably better suited for this problem. The INT approach does have one advantage though: if there is nothing else to do the device can be put in low power mode with the SLEEP instruction. Activity on INT will automatically wake the device up. I’ll post that implementation in a separate blog post.

The main control loop


My main loop looks like this:

// Main control loop.
 while (1) {

  // AppA: Decode Efergy Elite signal. 
  if (efergy_elite_interrupt_decode()) {

   // Have a complete record

   // Extract single phase power reading (12 bits)
   power = ((ee_buf[3]&0x0f) << 8) | ee_buf[4];

   // Display full record on the serial port
   for (i = 0; i < 8; i++) {
    writeHex(ee_buf[i]);
    putch (' ');
   }
   crlf();
  }


  // AppB: Blink LED if power use above threshold
  if (power > POWER_THRESHOLD) {

   // Cause LED to blink every 4096 iterations
   if ( (t&0x0fff) == 0) {
    DEBUG_PIN = !DEBUG_PIN;
   }
  } else {
   // LED off if below threshold
   DEBUG_PIN=0;
  }

  // Increment iteration counter
  t++;

  // Clear watchdog timer
  CLRWDT();    
 }
}

This has just two simultaneously running tasks:
  • One to decode telemetry from the Efergy Elite and write the data to the serial port
  • One to blink a LED if power levels are above some threshold
Instead of putting each application into a separate service function as in the template above, I've got blocks of code in the main loop as the code is short and simple.

The LED blinker (AppB) illustrates how to write these application service routines. A simplistic approach would be to compare power consumption against the threshold then turn on the LED, execute a delay loop for 0.5s, turn the LED off and delay again for another 0.5s. That will work, but violates the principle that the code should execute as quickly as possible (taking a whole second to complete a blink).

A smarter approach is implement LED blinking with a timer. I added an iteration counter to the main loop which acts as a low accuracy timer (it seemed easier than using the PICs built in timers). This way the code only takes a few instructions to execute.

The code which writes the record data to the serial port could be optimized in a similar way, writing just one character to the serial port per iteration. But that's an exercise for another day.

The Hardware

You will need the following:
  • Efergy Elite electricity monitor (obviously)
  • A PIC 16F627A or 16F628A (or any other PIC, but you may need to modify the code a little).
  • 1 LED
  • 1 resistor
  • A suitable PIC programmer. I use a PICKit2 from Microchip (about $30)
  • Breadboard (or other prototyping system)
  • Logic level Serial IO to PC interface (see text below)
This hack requires that you solder a wire to the base band pin or test pad of the Efergy Elite receiver unit. See my previous blog post on how to do this.  You will also need a wire for the battery ground. Beware that this will void your warranty -- so only proceed if you know what you are doing.
Schematic of Efergy Elite decoder using a PIC 16F627A or 16F628A (or equivalent).
Once upon a time interfacing a serial IO port to a PC was a straightforward if somewhat laborious task. PCs had a RS232 port which used +/- 13V levels which was not compatible with logic levels (usually 0 and 5V). You needed a level converter. A MAX232 chip + associated capacitors being one of the most popular solutions. Fortunately, nowadays the RS232 is very rarely found on modern equipment. So how do you interface serial IO at logic levels to a PC? There are many options available, and sadly may require that you purchase some hardware. But the good news is that all of these options are useful tools which can be repurposed for other projects. Here are some options:
  • FTDI cable available from SparkFun.com (DEV-09718), CoolComponents.co.uk and many others. Cost about $18.
  • The Dangerous Prototypes Bus Pirate available from SeeedStudio.com ($30 -- but you get a whole load of extra functionality with that. Well worth it.)
  • An old Nokia phone cable
  • Any development board that features a USB/Serial IO chip can probably be easily hacked for this purpose, including the Arduino, TI MSP LaunchPad etc. (Although you'd probably want to ask yourself if you are better off using the MCU on the development board instead of a separate PIC. If you want to see this decoder implemented for other MCUs leave a comment at the end of the blog post and I'll see what I can do.)

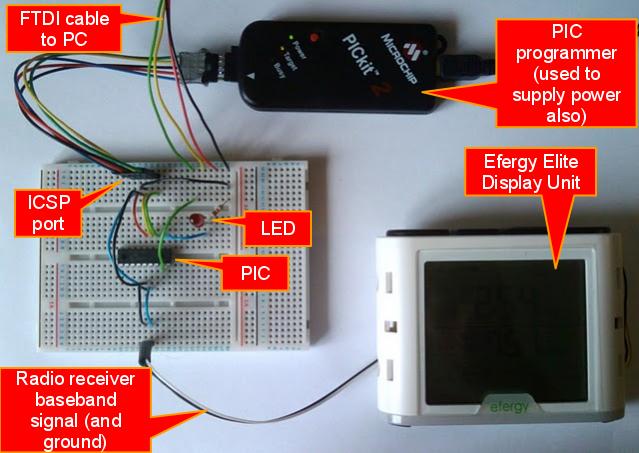
Annotated photograph of setup required to decode telemetry from a Efergy Elite electricity monitor and relay to PC.

A note on powering the PIC: as this is currently very much a prototype I haven't considered how I might power this device. Right now I'm using the PICKit2 to supply power via the ICSP (3.3 - 5V should work). Practical options are to pull the battery positive terminal out of the Efergy Elite display unit and use that to power the device. If connected to a PC via a FTDI cable, these cables usually have a +5V line which will deliver plenty of current. Or use a separate battery or wallwart power supply.

If running successfully this program will output to the serial port each record from the power sensor as it arrives (every 6, 12 or 18s). The output looks something like this:


EM 0.2.0
00 0D 5A 40 6E 00 01 00 
00 0D 5A 40 73 00 01 00 
00 0D 5A 40 6E 00 01 00 
00 0D 5A 41 BF 00 01 00 
00 0D 5A 41 BE 00 01 00 

As for implementing the temperature sensors I mentioned at the start -- that's for another day. So right now it’s not a terribly exciting application, but could form the basis of something more useful.

The code can be downloaded here. It’s written for the HI-TECH PICC compiler, and has been tested on PICs 16F627A and 16F628A. It should be easy to adapt to other PIC compilers and PIC devices, or indeed other MCU families.